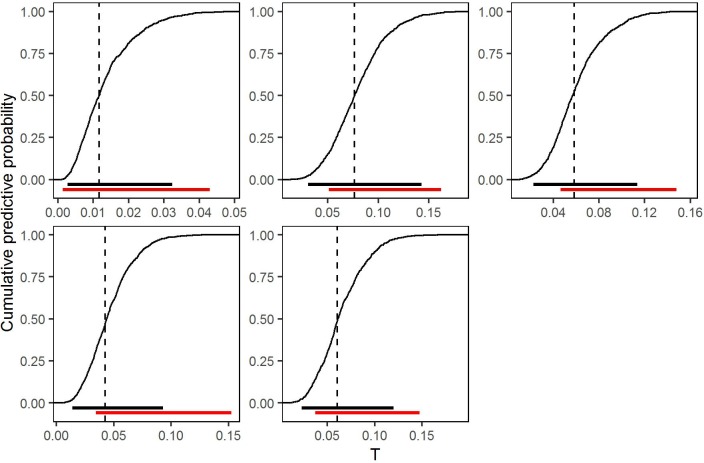
Fig 7. Cumulative predictive distributions of T, the proportion of village residents with parasite count greater than c = 8000/ml, for the five randomly selected villages shown in Figs 3 and 5, based on the fitted model without covariates.
Dashed vertical lines show the point predictions. Black horizontal lines show equal-tailed 95% plug-in predictive intervals. Red horizontal lines show the corresponding 95% confidence intervals for the true proportions based on the binomial sampling distribution of the observed numbers of individuals in each village with parasite count greater than c = 8000/ml.

