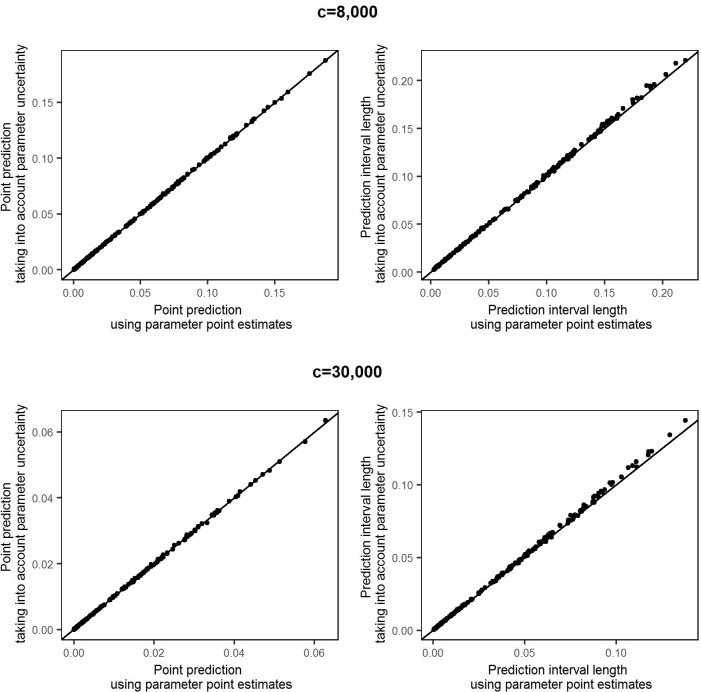
Fig 8. Comparison of predictions using the reported point estimates of model parameters and taking into account the uncertainty around the estimated parameter values.
The upper row shows point predictions (left column) and prediction interval lengths (right column) for a high infection threshold c = 8,000. The lower row shows the corresponding comparsions for a threshold c = 30,000.

