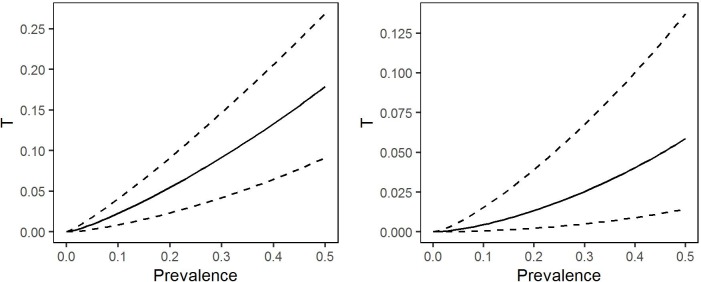
Fig 9. Selected quantiles of the conditional probability distribution of the proportion of individuals with intensity of infection greater than c = 8,000 parasites per ml of blood (left-hand panel) or c = 30,000 parasites per ml of blood (right-hand panel), as functions of village-level prevalence.
The median (solid line) provides a “best guess” of the relationship between prevalence and proportion of highly infected individuals; the 2.5% and 97.5% quantiles indicate the imprecision of this best guess.

