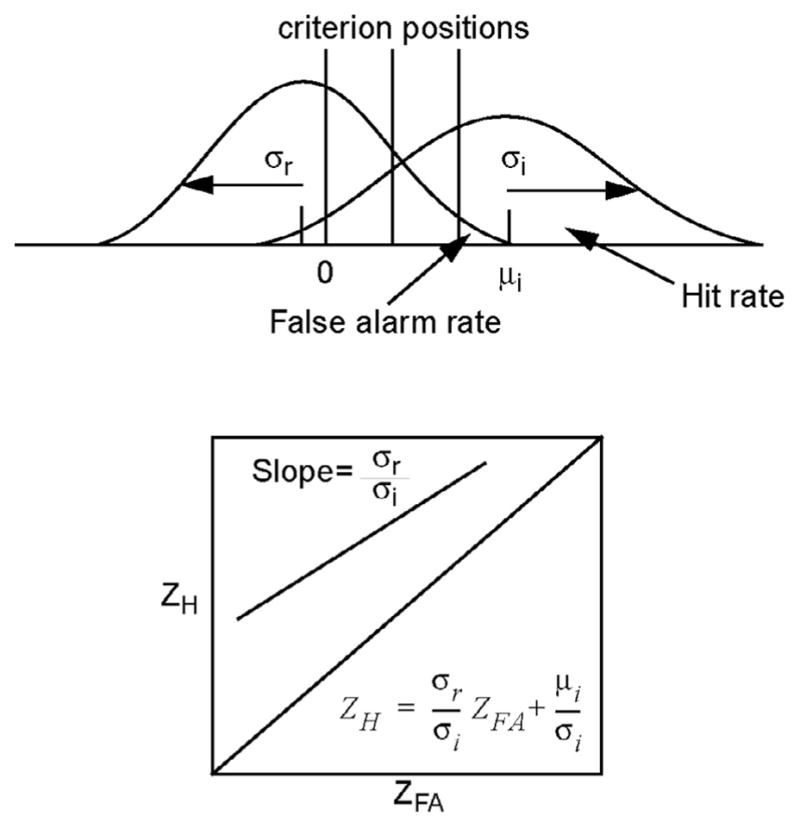
Fig. 1.

The standard Signal Detection model with one normal distribution each for the intact and rearranged items respectively, four response regions created by three confidence criteria, the z-ROC obtained from the two distributions, and the equation relating the z-transformed hit and false alarm rates.
