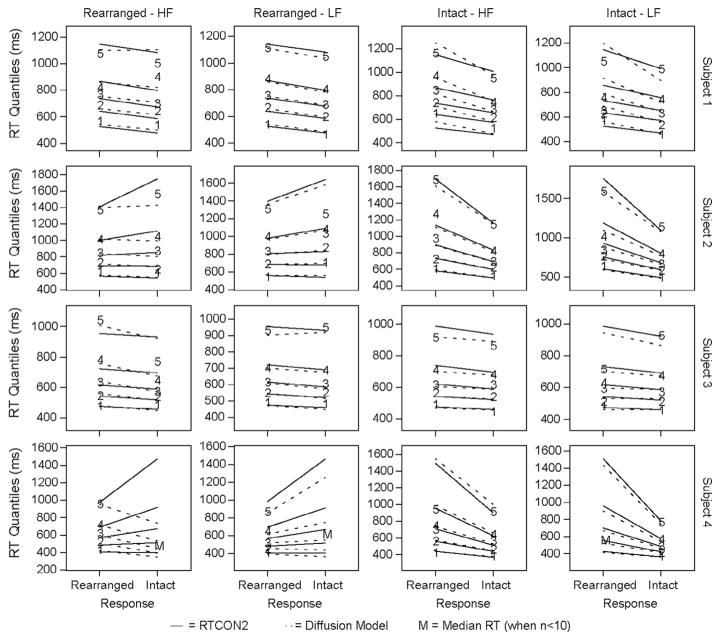
Fig. 11.
Experiment 2: Quantile reaction times from the two-choice task for each condition for each subject. The numbers 1–5 depict the RT quantiles from the behavioral data, the solid lines depict the predictions from RTCON2, and the dashed lines depict the predictions from the diffusion model. In conditions where subjects made fewer than 10 responses the median RT is plotted as an ‘M’ and the other quantiles are not included.

