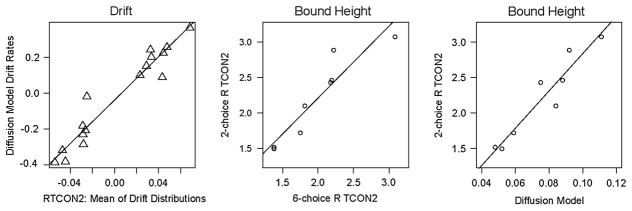
Fig. 13.
Experiment 2: Comparison of drift rates and decision bounds across the models along with best-fitting linear regression lines. In the figure on the left, drift rate values have been shifted and adjusted to account for differences in how the models parameterize drift rates. In the middle figure, for the 6-choice RTCON2 model the heights of the ‘intact’ and ‘rearranged’ response options were averaged over confidence level. In the figure on the right, for the diffusion model the total distance between the two decision boundaries (a) was split into the distance from the starting point (z) to produce two values (z and a–z). Original values for all parameters are available in Tables 3–5.

