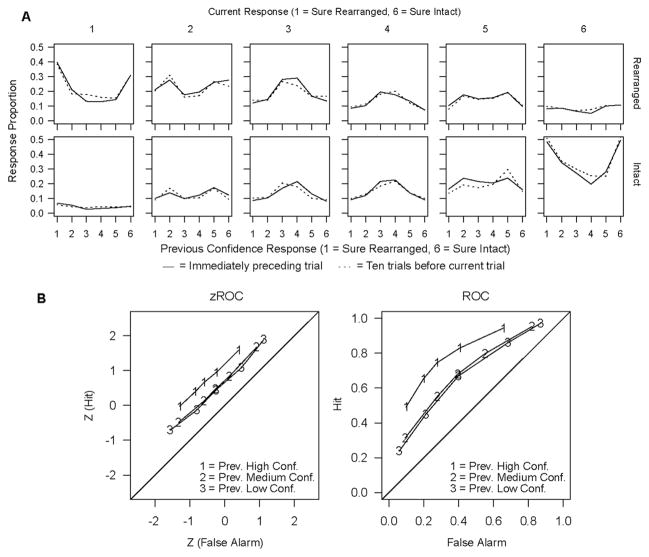
Fig. 16.
Experiment 3: Sequential effects. (A) Response proportions as a function of previous responses. Response proportions for each confidence response (1–6) and each condition (intact and rearranged) are plotted separately as a function of a previous response. The solid lines show the response proportions for each condition and response option sorted based on the response from the immediately preceding trial and the dashed lines show the response proportions sorted based on response from a trial ten trials before the current trial. So the upper left plot shows the proportion of ‘sure rearranged’ responses made to rearranged pairs as a function of the previous response (solid line) and as a function of the response ten trials previous (dashed line), the upper right plot shows the proportion of ‘sure intact’ responses made to rearranged pairs, and so on. (B) z-ROC and ROC functions for averaged data as a function of previous responses. Data were collapsed across previous ‘intact’ and ‘rearranged’ responses to produce three conditions based just on the confidence level of the immediately preceding response (1: high, 2: medium, and 3: low).

