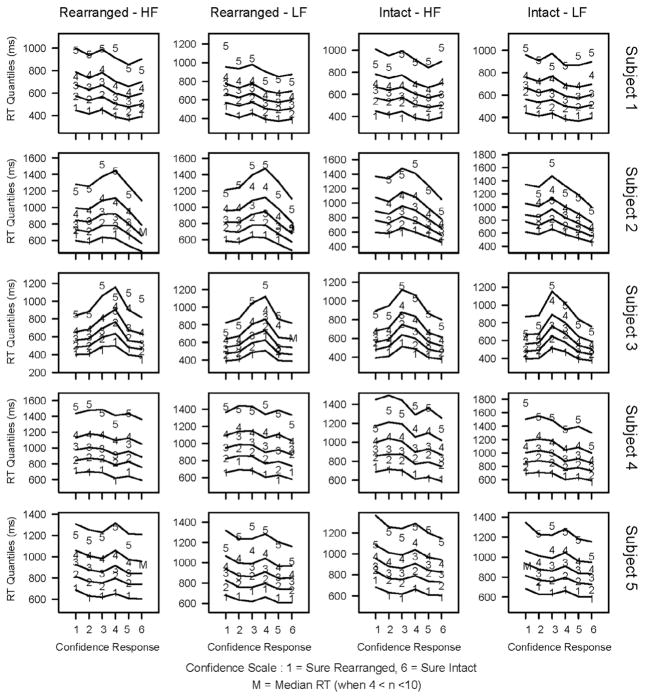
Fig. 3.
Experiment 1: Quantile reaction times for each condition for each subject. Confidence responses are plotted along the x-axis (ranging from 1: Sure Rearranged to 6: Sure Intact). The numbers 1–5 depict the RT quantiles from the behavioral data and the corresponding lines depict the predictions from RTCON2. In conditions where subjects made between 4 and 10 responses the median RT is plotted as an ‘M’ and the other quantiles are not included. Conditions where subjects made fewer than 5 responses are omitted from the figure (e.g., subject 2 made fewer than 5 ‘Sure Rearranged’ responses to intact low-frequency word pairs so there are no behavioral data plotted for that condition).

