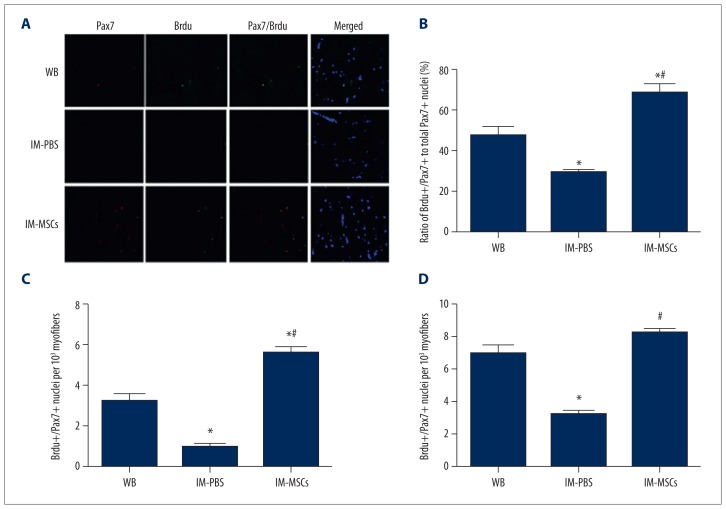
Figure 4.
Satellite cell proliferation. (A) Immunohistochemistry of soleus cross-sections from all groups: Pax7 (red) and BrdU (green) expression, and nuclear (DAPI blue) identification. Yellow staining represents Pax7 and BrdU double-positive nuclei. Scale bar=25 mm. (B) Ratio of BrdU+/Pax7+ nuclei within the total Pax7+population. (C) BrdU+/Pax7+double-positive nuclei per 103 myofibers. D). Total Pax7 immunoreactive nuclei. * p<0.05, vs. WB group; # p<0.05, vs. IM-PBS group. The data presented are the mean ± standard deviation.

