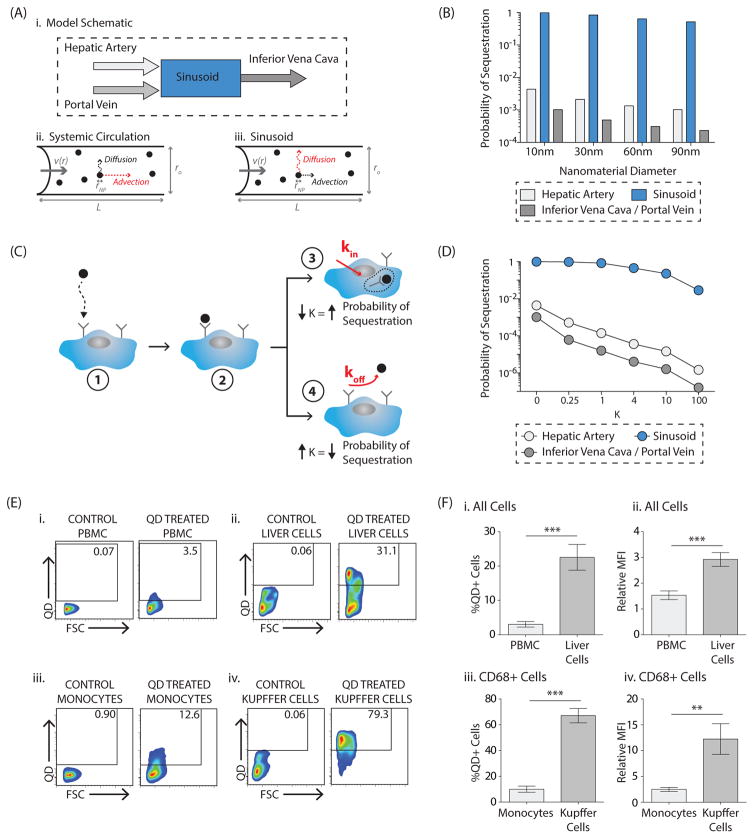
Figure 2. Nanomaterial sequestration in the liver versus in the systemic circulation: mathematical modeling and in vivo results.
A, Model schematic (i). In the systemic circulation (e.g. hepatic artery, portal vein, inferior vena cava), advection due to blood flow is the dominant factor influencing nanomaterial transport (ii). In the liver sinusoid, diffusion due to Brownian motion is the dominant factor influencing nanomaterial transport (iii). B, Results of the mathematical model comparing the probability of a nanomaterial being sequestered in a liver sinusoid versus in the systemic circulation. An absorbing boundary condition on the vessel wall was utilized. Impact of nanomaterial size, between 10–90nm, is demonstrated. Numerical inputs to the model are included in Supplementary Table 1. C, Impact of imperfect adsorption was incorporated in the local sticking coefficient, K, where K ∝ koff kin. In the illustration, a nanomaterial reaches a cell by Brownian motion (1) and may bind to a cell receptor (2). There are then two possible scenarios. In (3), the nanomaterial has a higher probability of internalization into the cell cytoplasm, decreasing K and increasing the overall probability of sequestration. Alternatively, in (4), the nanomaterial has a higher probability of dissociation into the circulation, increasing K and decreasing the overall probability of sequestration. D, Results of the mathematical model probing the impact of varying values of K on the overall probability of sequestration in the systemic circulation and in the liver sinusoid for a 10nm nanomaterial. Impact of K on 30/60/90nm nanomaterials is included in Supplementary Figure 9. E, Representative flow plots comparing quantum dot uptake in vivo by cells in the peripheral blood (i, iii) versus in the liver (ii, iv) twelve hours post-injection. The first comparison is for all peripheral blood mononuclear cells (PBMCs, i) versus all cells in the total liver homogenate (ii). Full gating strategy is included in Supplementary Figure 10. The second comparison is for CD68+ monocytes (iii) with CD68+ Kupffer cells (iv). Shown are plots from the control vehicle-treated animal, ‘Control’, and the quantum dot-treated animal, ‘QD Treated’. Full gating strategy for uptake in CD68+ cells is included in Supplementary Figure 16A. F, Percentage of quantum dot-positive cells in the peripheral blood versus in the liver twelve hours after intravenous quantum dot injection (i, iii), where %QD+Cells = %QD+CellsQD Treated-%QD+CellsControl-Treated. In (i) quantum dot uptake in all PBMCs is compared with uptake in all total liver homogenate cells. In (iii) quantum dot uptake in monocytes is compared with uptake in Kupffer cells. Amount of quantum dot uptake for each cell type, where Relative Mean Fluorescence Intensity or Relative MFI=MFIQD-Treated/MFIControl-Treated. (ii, iv). Again, in (ii) the comparison is made for all cells while in (iv) the comparison is made for CD68+ cells (monocytes versus Kupffer cells). Plotted is the mean ± s.e.m. from 8 independent replicates. Statistical significance was evaluated using a two-tailed unpaired t-test (**P<0.01, ***P<0.001).

