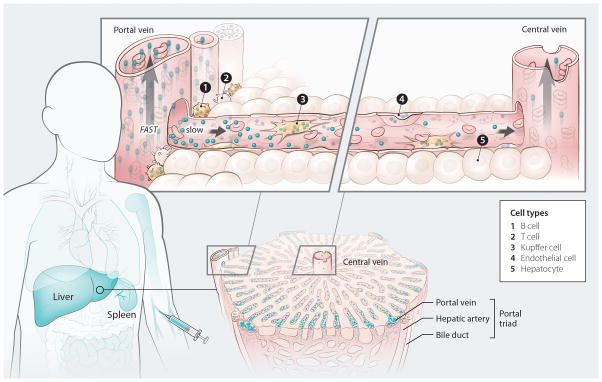
Figure 6. Mechanism of nanomaterial transport in the liver.
Nanomaterials injected into the bloodstream encounter the mononuclear phagocyte system (MPS), a group of organs that contain phagocytic cells. The intensity of the blue color in the figure reflects the degree of nanomaterial uptake within each MPS organ12 (see outline of human body, left). As the nanomaterials transition from the peripheral circulation to the liver, their velocity reduces 1000-fold. This allows the nanomaterials to interact with a variety of cells, resulting in their gradual clearance from the bloodstream. There is a concentration gradient of nanomaterials along the length of the sinusoid and the amount leaving the liver through the central vein is lower than the amount that enters via the portal triad (see image of liver lobule, bottom right). B and T cells border the portal triad and are exposed to a high concentration of incoming nanomaterials (see schematic of a liver sinusoid, top right). The difference in nanomaterial uptake between these cell types is due to the increased endocytic/phagocytic capacity of B cells compared with T cells. Nanomaterials that escape the first set of cellular interactions move along the sinusoid and can come into contact with endothelial and Kupffer cells. Hepatocytes are separated from the bloodstream by a layer of fenestrated endothelial cells and do not take up nanomaterials. Nanomaterials that escape uptake during a pass through the liver return to the systemic circulation via the central vein and are ultimately carried back to the liver (or another MPS organ). This process repeats itself until nanomaterial clearance from the bloodstream is complete.

