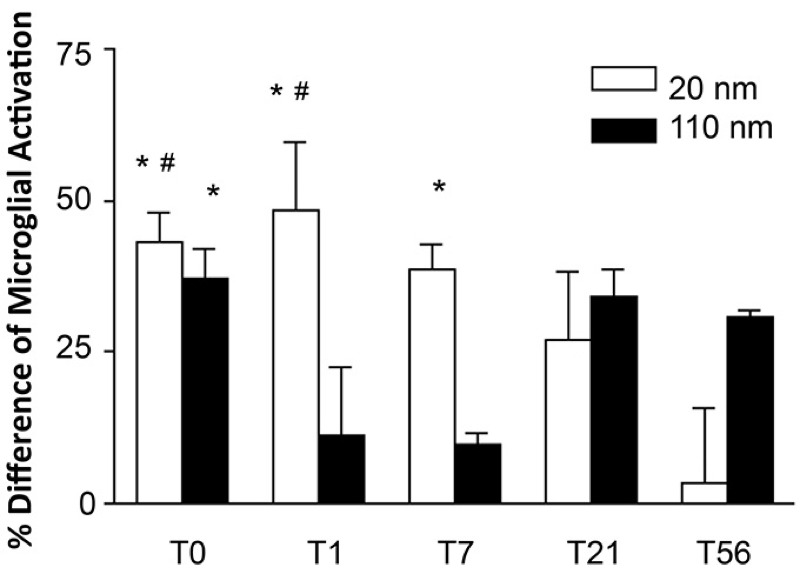
Figure 3.

Comparison of percent difference from control of activated microglia in the olfactory bulb between 20- and 110-nm silver nanoparticles at different post-exposure days. *Significantly different from citrate control (p < 0.05). #Significantly different from the mean value at post-exposure day 56 (T56) in animals that had the same exposure (p < 0.05). Values are the mean ± SE. The mean value was obtained from 3 animals per particle type and time point except for the group treated with 110-nm silver nanoparticles at T56, where the mean value was obtained from 2 animals.
