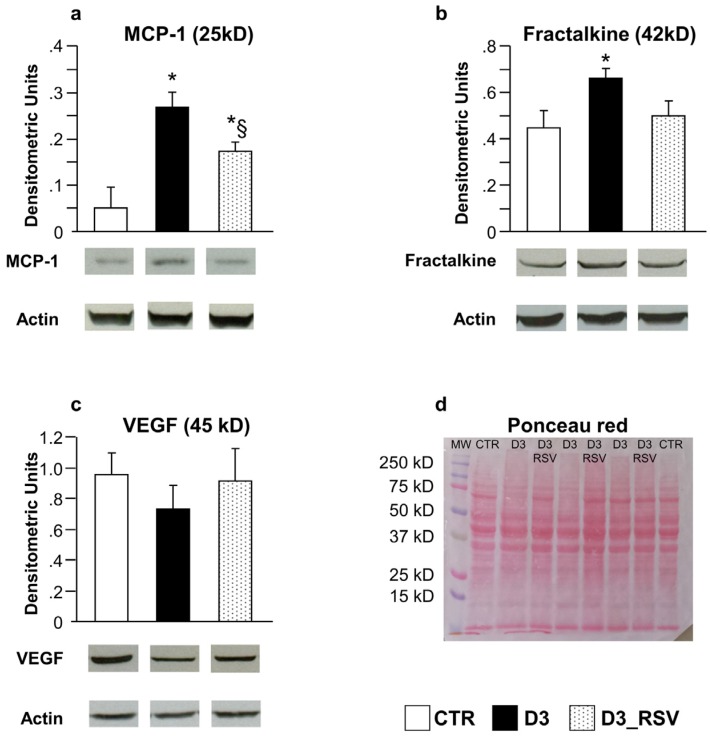
Figure 3.
RSV-treatment reduced diabetes-induced tissue inflammation. Mean values ± SEM of MCP-1 (a), Fractalkine (b) and VEGF (c) expression levels in LV myocardium of control (CTR), diabetic (D3) and RSV-treated diabetic rats (D3_RSV), after three weeks of hyperglycemia (Western blot assay). Quantitative comparisons were performed on data derived from different gels processed in parallel (see Methods). Sets of bands related to cytokine expression of three animals representative of the average behavior observed in each group are reported at the bottom of the corresponding graph. Lanes were not adjacent in the gel, as indicated by the white space between them. The visualization of all proteins in one membrane stained with Ponceau Red is reported in (d), together with the molecular weights. * p < 0.05 vs. CTR, § p < 0.05 significant differences between D3 and D3_RSV (Kruskal-Wallis analysis of variance and Mann Whitney U-test).

