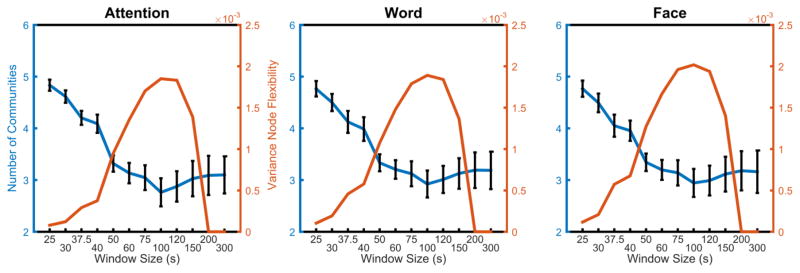
Figure 2. Average number of communities and variance vs. window size.
As the window size increases, the average number of communities decreases up to the window size of approximately 100 s. Following this point, the number of communities begins to increase again, albeit more slowly. The variance of flexibility increases as the window size increases, peaking at a window size of approximately 75–120 s, then decreasing to zero at the window size of approximately 200 s or 300 s.

