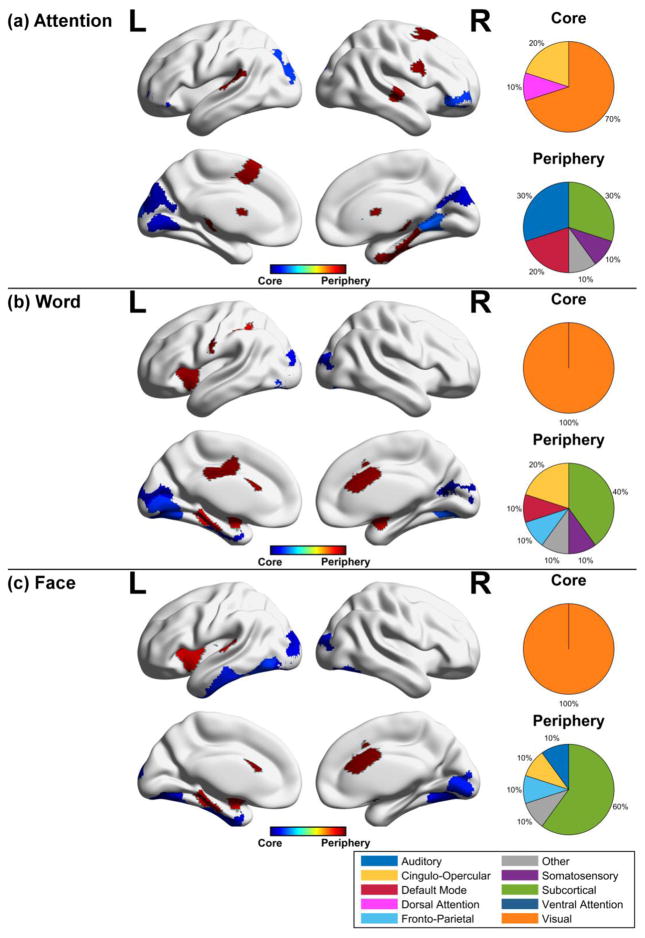
Figure 5. Temporal core and periphery regions for cognitive tasks.
Temporal core and periphery nodes defined as lying in the lower or upper 5th percentile of node flexibility, respectively, were grouped according to functional brain areas for the (a) attention, (b) word, and (c) face task. The pie chart denotes the proportion of nodes in the temporal core or periphery occupied by a given system. The most prominent regions in the temporal core across task are the visual areas, while the most prominent regions in the temporal periphery are the subcortical areas.

