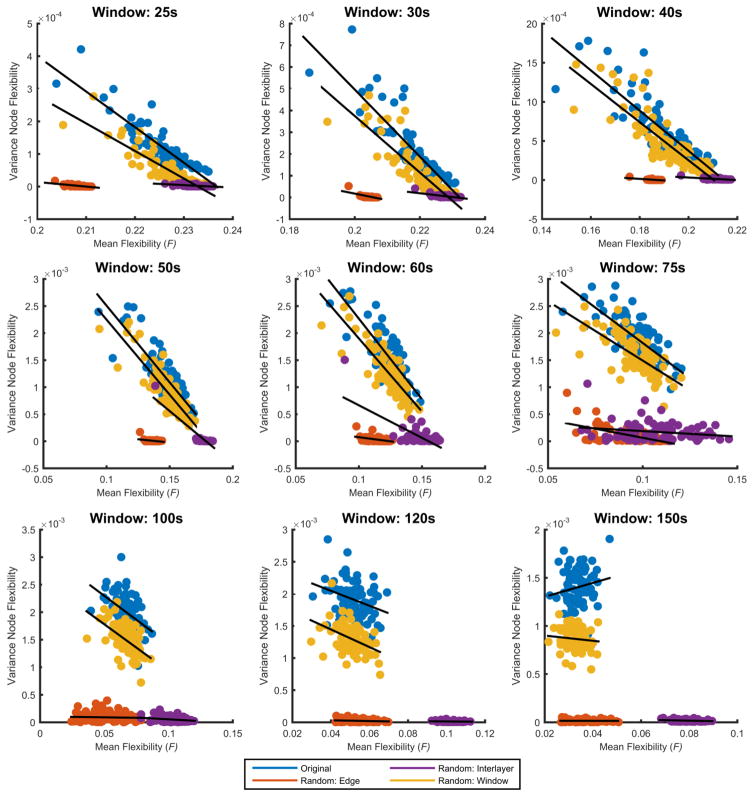
Figure 7. Individual differences across tasks.
Here we show scatter plots of the mean node flexibility across all tasks versus inter-task variance of node flexibility for each subject. R2-values were 0.81, 0.76, 0.74, 0.74, 0.67, 0.54, 0.22, 0.10 and 0.03 for window sizes 25s, 30s, 40s, 50s, 60s, 75s, 100s, 120s, and 150s, respectively. Additionally, mean node flexibility versus inter-task variance was calculated for the three null models.

