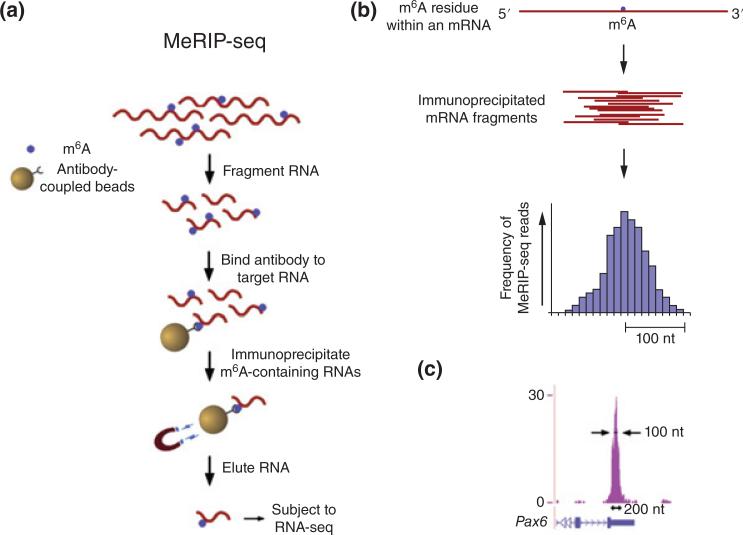
FIGURE 4.
Outline of MeRIP-Seq protocol and distribution of sequencing reads. (a) Schematic representation of MeRIP-Seq. Total RNA is subjected to RiboMinus treatment to remove rRNA species. RNAs containing m6A are then immunoprecipitated by mixing the RNA with m6A antibody-coupled Dynabeads. m6A-containing RNAs are then eluted from the antibody-coupled beads and subjected to a second round of m6A immunoprecipitation. The resulting RNA pool, which is highly enriched for m6A-containing RNAs, is then subjected to next-generation sequencing. (b) Schematic of sequencing reads and their alignment to locations in the genome surrounding an m6A site. (Top) An mRNA that contains a single m6A residue along its length. (Middle) Individual 100 nt wide mRNA fragments that are isolated following m6A immunoprecipitation, each of which contains the same m6A residue from the mRNA depicted above. (Bottom) Histogram showing predicted frequency of MeRIP-Seq reads obtained by sequencing individual immunoprecipitated fragments. Read frequency is predicted to increase with closer proximity to the m6A site, forming a ‘peak’ that is roughly 200 nt wide at its base and 100 nt wide at its midpoint. (c) Sequencing reads from MeRIP-Seq converge over m6A sites. Representative UCSC Genome Browser plot from MeRIP-Seq data, which demonstrates typical read frequency peak formation surrounding a site of m6A (shown here is the 30 UTR of Pax6). Peak height is displayed as reads per base per million mapped reads (BPM). (Reprinted with permission from Ref 44. Copyright 2012 Cell Press)

