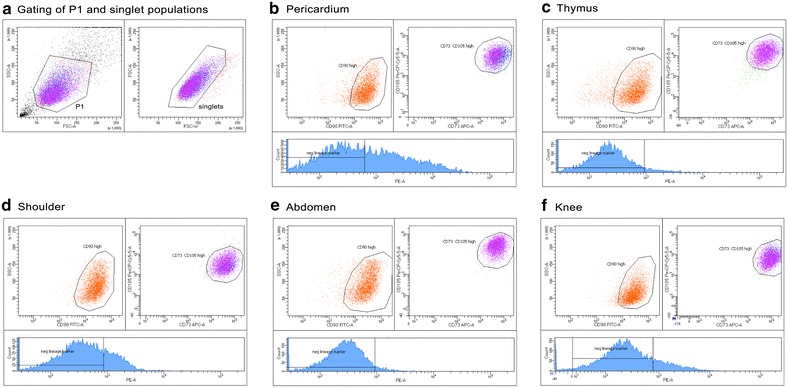
Fig. 1.

Flow cytometry characterization of isolated ASCs. Representative gating of P1 and singlet populations (a), and flow cytometry analysis for ASCs isolated from pericardium (b), thymus (c), shoulder (d), abdomen (e), and knee (f) (n = 3 for each location). The histogram for each tissue type depicts the negative lineage hematopoietic markers. For each respective anatomical location, the P1 population is positive for CD markers 90, 73, and 105. The histogram for each tissue type shows the negative lineage hematopoietic markers and HLA-DR, with the bars defined based on an unstained and isotype control. This characterization shows that the populations of isolated ASCs contain a majority of mesenchymal stem cells with limited contamination by hematopoietic cells
