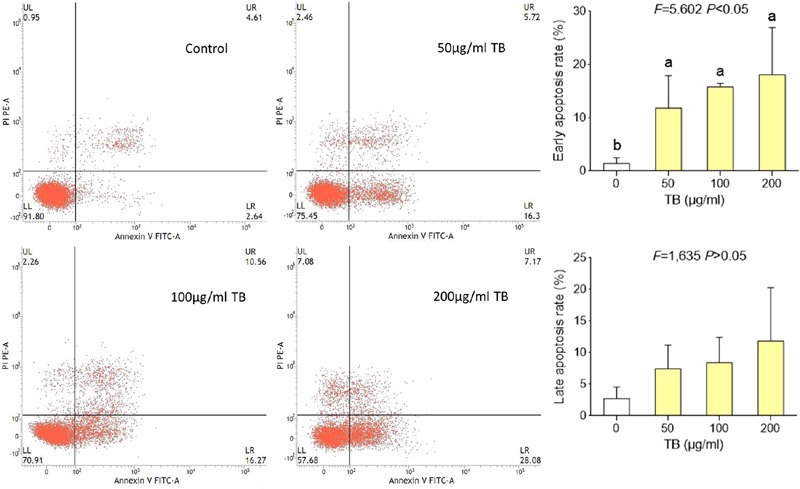
FIGURE 5.

Flow cytometry analysis of A549 cell apoptosis by double staining with Annexin V-FITC and propidium iodide (PI). Values are presented as mean ± SD of three independent experiments. Different lower case letters indicate significant difference between groups (Fisher’s LSD, P < 0.001).
