
FIGURE 3.
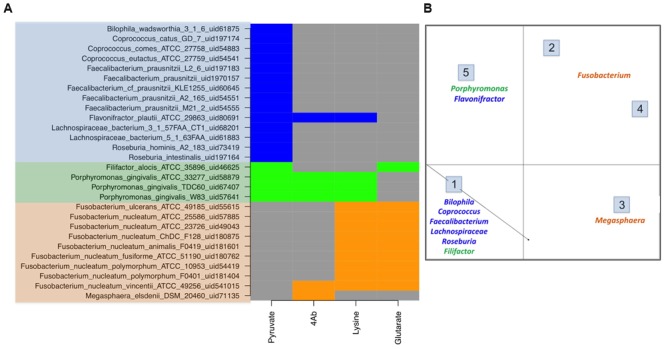
Butyrate production pathway composition in commensals vs. pathogens. (A) The figure depicts the pathway distribution in bacteria which form a part of human microbiome. The gut commensals (blue), gut pathogens (orange) and oral pathogens (green) show differential presence of butryogenic pathways. (B) Clustering of human microbiome bacteria on the basis of pathway presence.