
FIGURE 7.
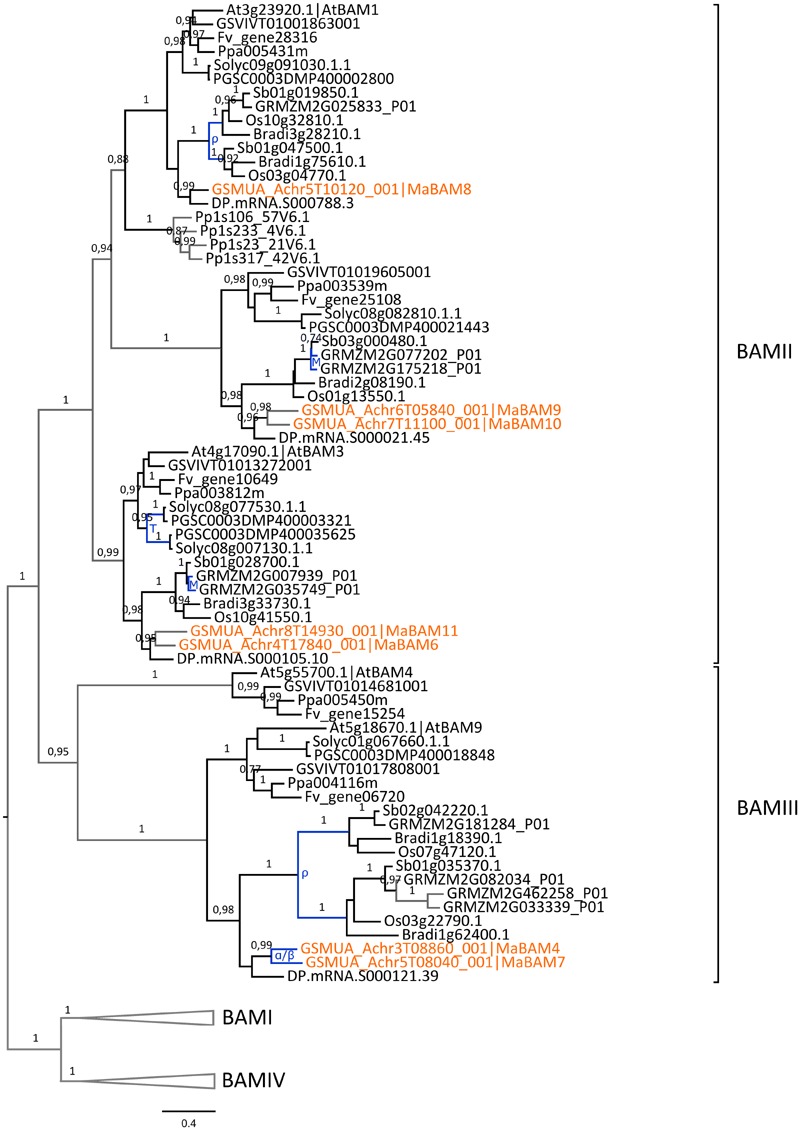
Phylogenetic analysis of the BAM family. The maximum likelihood tree of BAM predicted proteins was rooted on midpoint. BAMI and BAMIV sequences are collapsed from the original tree (Supplementary Figure S3). Supports > 0.70 (aLRT statistics with SH–like procedure) are indicated. Physcomitrella patens (Pp), grapevine (GSVIV), tomato (Solyc), potato (PGSC), woodland strawberry (Fv), Arabidopsis (At), peach (Ppa), Brachypodium (Bradi), rice (Os), maize (GRMZM), sorghum (Sb), date palm (DP) and banana (GSMUA) identifiers are indicated (in brown for banana). Branches are colored according to gene duplication modes: WGD (blue) and unknown (gray). Black branches correspond to speciation events. WGD events identified using reconstructed ancestral blocks are indicated (blue letters). The scale bar corresponds to estimated amino acid substitutions per site. Sequences were grouped using the tree topology and a previous classification (Fulton et al., 2008).