Figure 2.
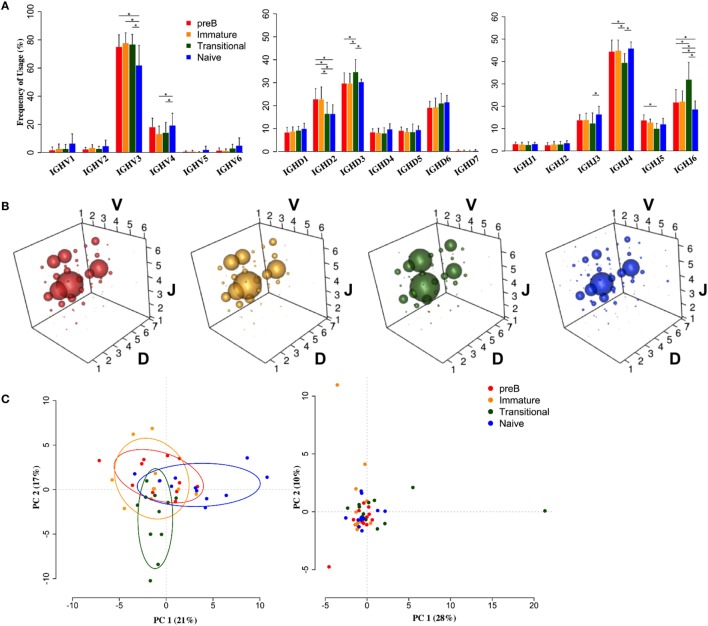
Heavy chain VDJ gene family usage distinguishes cell types. (A) Mean frequency histograms of individual V, D, and J family usage for the heavy chain gene families of Pre-B (red), immature (yellow), transitional (green), and naïve (blue) cells (*p < 0.05 by two way ANOVA with multiple analysis correction. Error bars are SEM). (B) VDJ family combination usage in the different cell types. The size of a bubble represents the mean frequency of that VDJ combination. (C) Transitional and naïve cells show difference in VDJ family usage by principle component analysis (PCA) (left) compared to a randomise data set (right).

