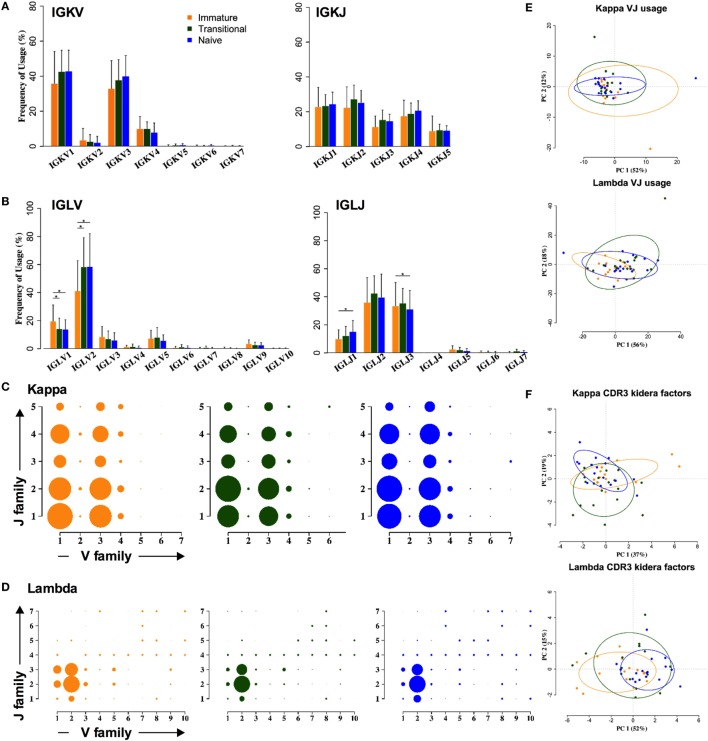
Figure 3.
Light chain gene usage and CDR3 properties cannot distinguish between cell types. (A,B) V and J family usage for kappa (A) and lambda (B) light chain gene families between immature (yellow), transitional (green), and naïve cell types (*p < 0.05 by two way ANOVA with multiple analysis correction. Error bars are SEM). (C,D) Light chain VJ usage for kappa (C) and lambda (D) light chains in immature (yellow), transitional (green), and naïve (blue) B cells. The size of a circle indicates the relative mean frequency of the VJ combination. (E,F) Principle component analysis (PCA) of VJ usage (E) and Kidera factors (F) in three different cell types for kappa (top) and lambda (bottom).

