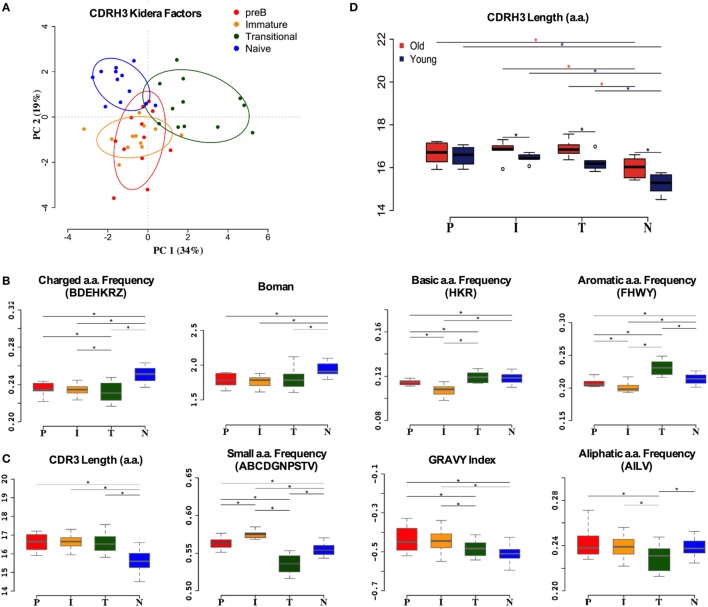
Figure 5.
Heavy chain CDR3 characteristics distinguish between cell types. (A) Distinction between the different cell types by Kidera factors as illustrated by principal component analysis (PCA). Distribution of CDRH3 physicochemical properties that have an increased trend from pre-B (P), immature (I), transitional (T) to naïve (N) cells (B), and a decrease in naïve cells compared to pre-B cells (C) (*p < 0.05 ANOVA). (D) The heavy chain CDR3 length in all cell types in young and old donors (young donors: 18–50 years; old donors: over 65 years) (*p < 0.05 ANOVA). Values on the y axis of (B–D) are as per the individual graph titles.

