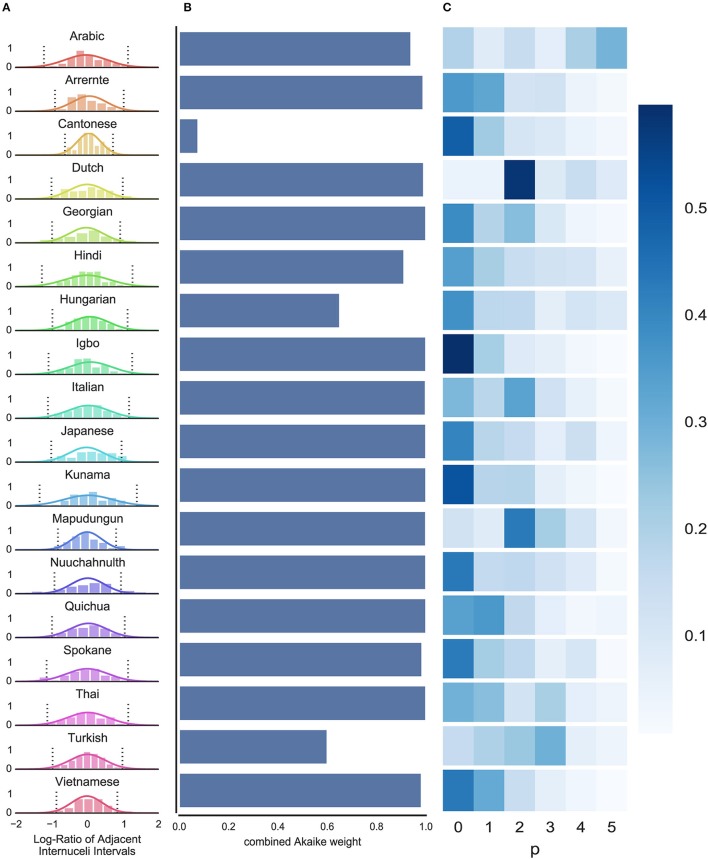
Figure 3.
Results of Bayesian and time series analyses. (A) Distributions of the log-ratio of adjacent INIs for all languages: most languages have a wider spread, indicating less predictability; a few languages show a narrower distribution (e.g., Cantonese), indicating higher predictability at this level. Normalized histograms show the raw empirical data; Solid lines show the ideal learner predictions; Dashed lines show 95% confidence intervals for the ideal learner predictions. (B) The proportion of Akaike weights taken up by models that use the ratio between subsequent INI lengths (differencing order d = 1; as opposed to the absolute lengths, d = 0) shows that, in the vast majority of language samples, the relative length data provide a better ARMA fit (cfr. last column in Table 1, % Akaike weight taken up by d = 1). (C) The accumulated Akaike weights of all fitted ARMA models for each AR-order p do not show a clear picture of a predominant order of the ARMA model providing the best fit.

