
Figure 12.
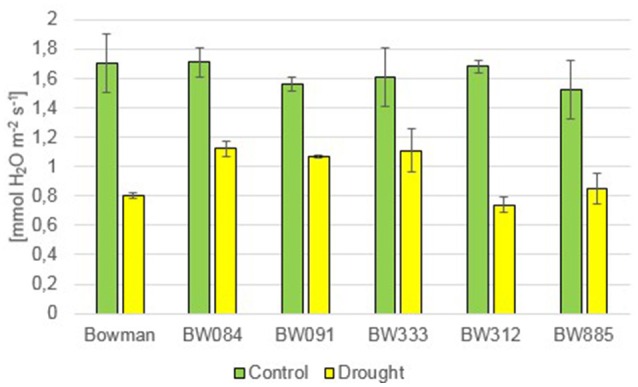
The transpiration rate in the analyzed genotypes under the control and drought conditions. The mean values of seven replicates of each measurement are presented for each genotype, with error bars representing standard deviation.
Official websites use .gov
A
.gov website belongs to an official
government organization in the United States.
Secure .gov websites use HTTPS
A lock (
) or https:// means you've safely
connected to the .gov website. Share sensitive
information only on official, secure websites.
The transpiration rate in the analyzed genotypes under the control and drought conditions. The mean values of seven replicates of each measurement are presented for each genotype, with error bars representing standard deviation.