
Figure 3.
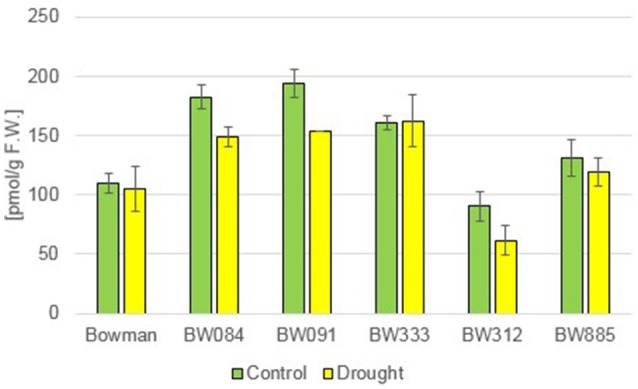
The endogenous concentrations of 28-homocastasterone (28-homoCS) in the analyzed genotypes under the control and drought conditions. The mean values of three replicates of each measurement are presented for each genotype, with error bars representing standard deviation.