
Figure 4.
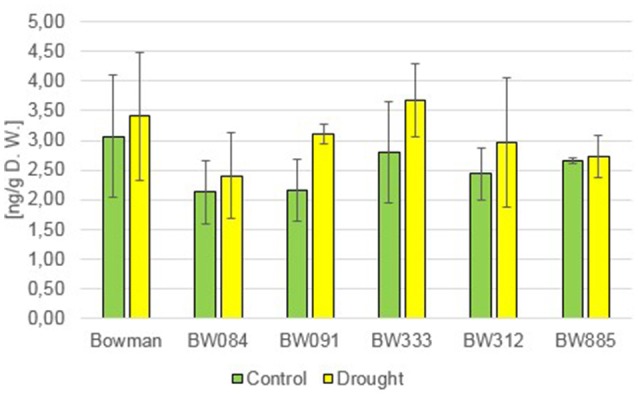
The endogenous contents of the gibberellin GA4 in the analyzed genotypes under the control and drought conditions. The mean values of three replicates of each measurement are presented for each genotype, with error bars representing standard deviation.