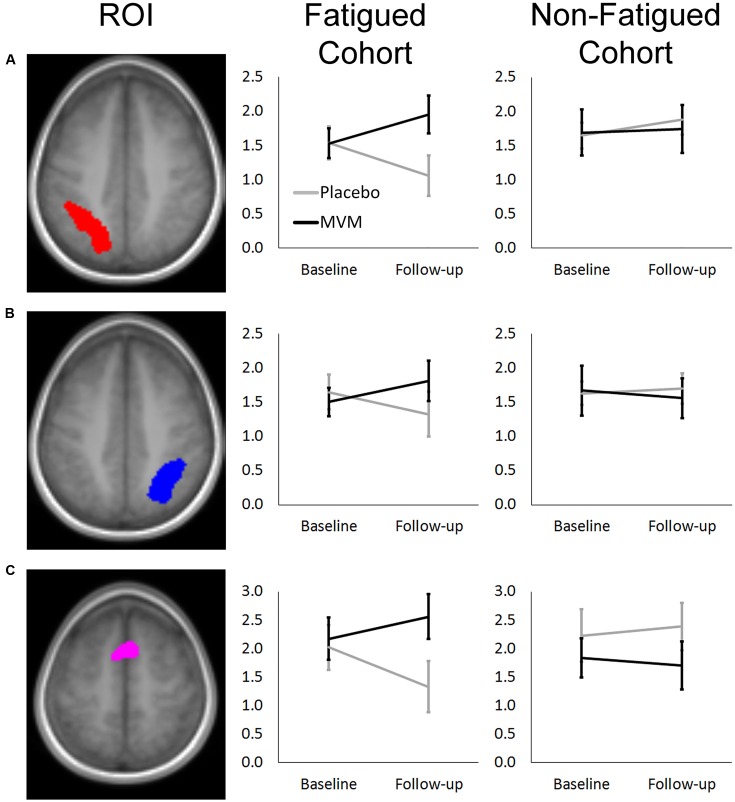
FIGURE 1.
Mean RVIP task contrast estimates extracted at baseline and post-treatment for fatigued (left) and non-fatigued (right) cohorts for (A) Left Parietal, (B) Right Parietal, and (C) SMA regions of interest, where significantly greater task-related activity was observed in active treatment group post-treatment within the fatigued cohort. Error bars ±1 SE.

