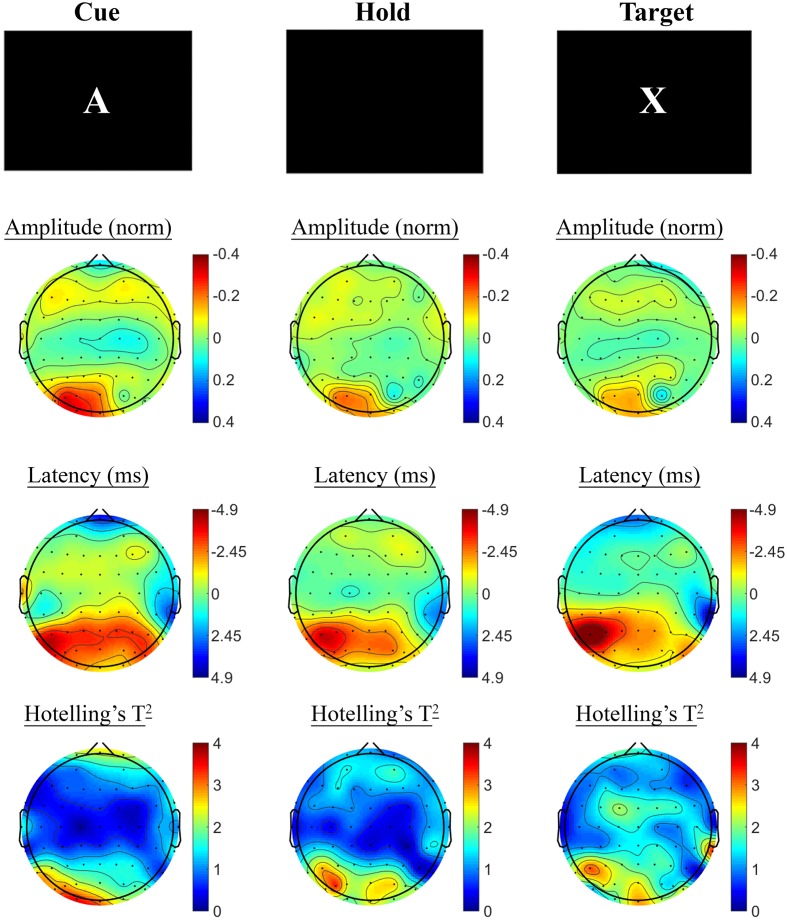
FIGURE 4.
A-X CPT SSVEP amplitude and phase changes from baseline to post-treatment in the placebo group. Columns show topographic maps of SSVEP amplitude (top) and phase (as latency, middle), with Hotelling’s T2 corresponding to the contrast of active and control task variants for Cue (Left), Hold (Middle), and Target (Right) task segments.

