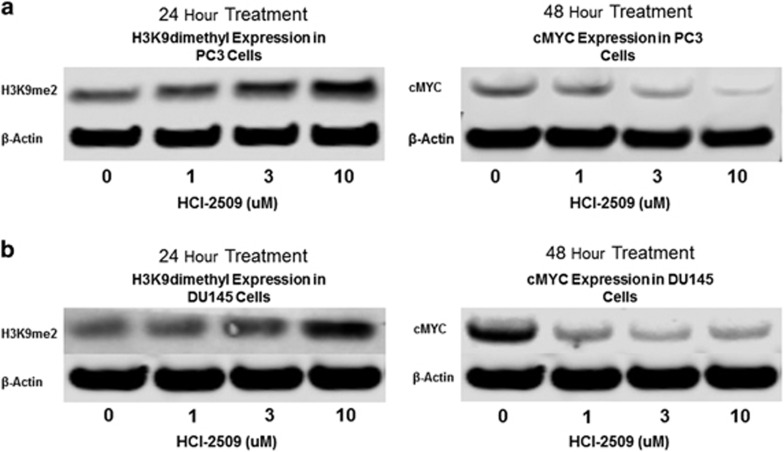
Figure 3.
Western blot analysis of H3K9me2 and c-MYC levels upon treatment with increasing concentrations of HCI-2509 as compared with vehicle in (a) PC3 and (b) DU145 cells. The bands of c-MYC, β-actin and H3K9me2 proteins on the immunoblot were cropped using PowerPoint (Windows) to show correlating change in intensities with different levels of treatment with HCI-2509. (Replicated two more times, representative blot shown).

