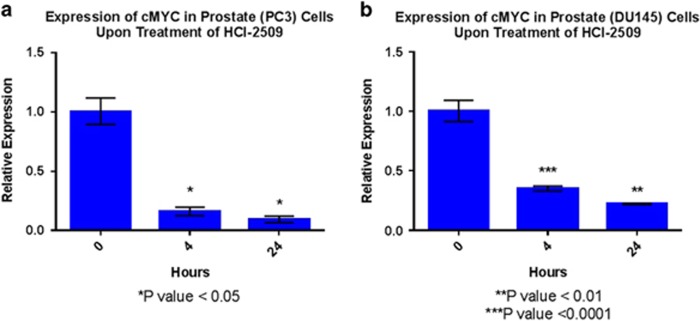
Figure 4.
Quantitative reverse transcription-PCR (RT-PCR) analysis of c-MYC oncogene in (a) PC3 and (b) DU145 cells after treatment with HCI-2509 for 4 and 24 h. Each replicate was normalized to the reference gene (S18) and induction was calculated relative to the vehicle control. The relative expression of c-MYC mRNA in various conditions was plotted in the form of bar graphs and relative inhibition on treatment with HCI-2509 was tested for significance using the unpaired t-test (GraphPad Prism). Assays were performed in quadruplicate and error bars indicate the standard deviation.

