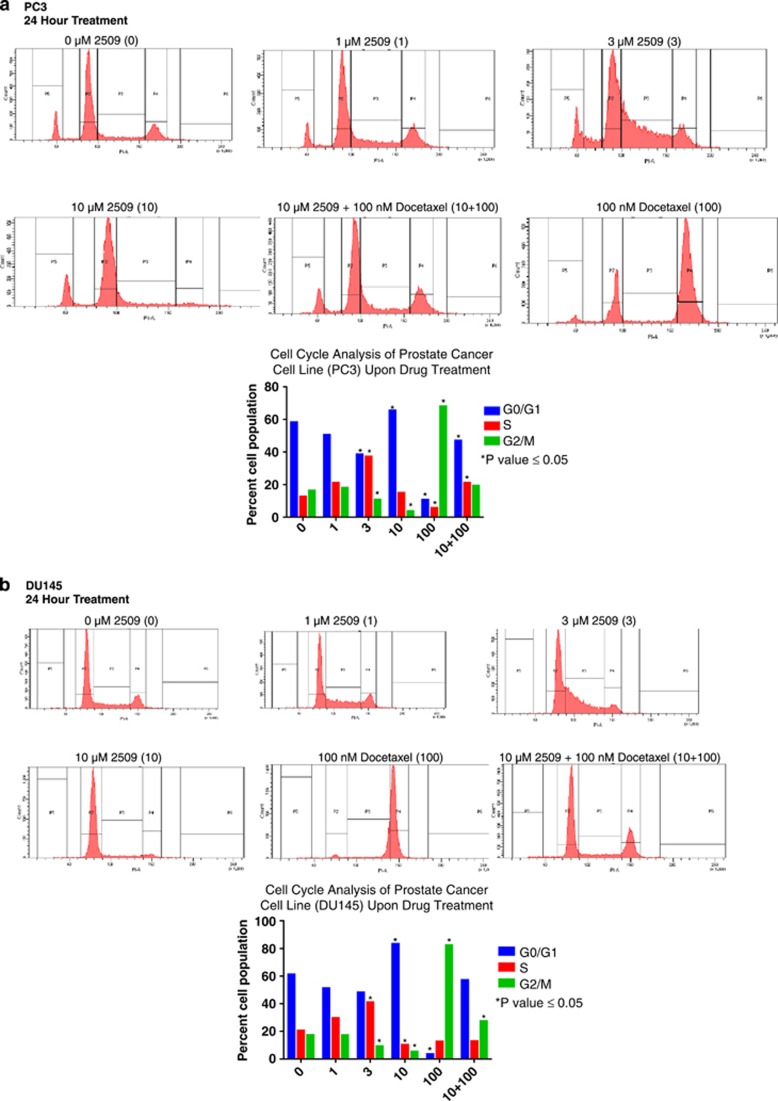
Figure 5.
Cell cycle study of percent cell populations in various phases after treatment with vehicle, HCI-2509 in increasing concentrations and docetaxel alone and in combination with HCI-2509 using (a) PC3 and (b) DU145 cells. Student's unpaired t-tests, using GraphPad Prism software, were used to calculate two-tailed P-values for each experiment to determine statistical significance between untreated and treated samples. The statistically significant P-values are labeled in each figure with an asterisk. (Replicated two more times, representative graph shown).

