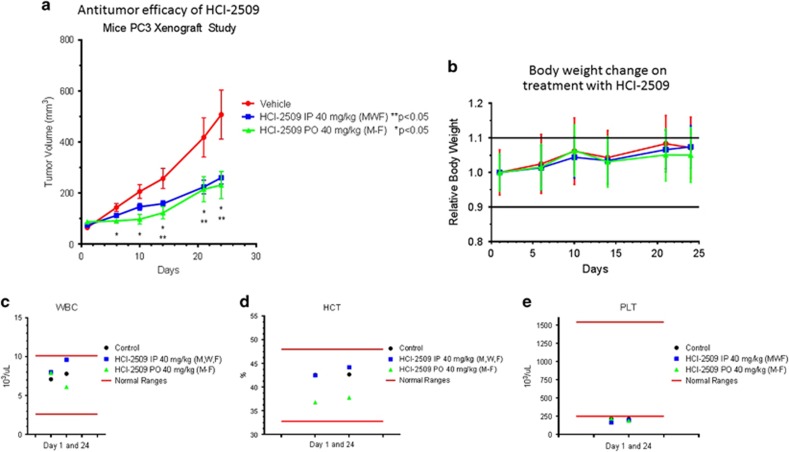
Figure 6.
PC3 xenograft study shows efficacy and tolerability of HCI-2509 in vivo. (a) Tumor volume (TV) plotted versus time in different treatment arms—vehicle, intraperitoneal HCI-2509 and per os HCI-2509. The mean TV with error bars to show the standard error of mean (s.e.m.) has been used for the three groups. (b) Relative body weight (BW) of mice in the three treatment arms plotted versus time while on study. Relative mean BW with error bars representing s.e.m. in each group are used. Change in (c) white blood cell count, (d) hematocrit and (e) platelet count in the three treatment arms. Data are represented by creating graphs using the GraphPad Prism software. Statistical analysis of the change in mean tumor volume in each arm with time and treatment was performed using two-way analysis of variance (ANOVA) test. The changes in tumor volume with both forms of treatment as compared with control were found to be significant.

