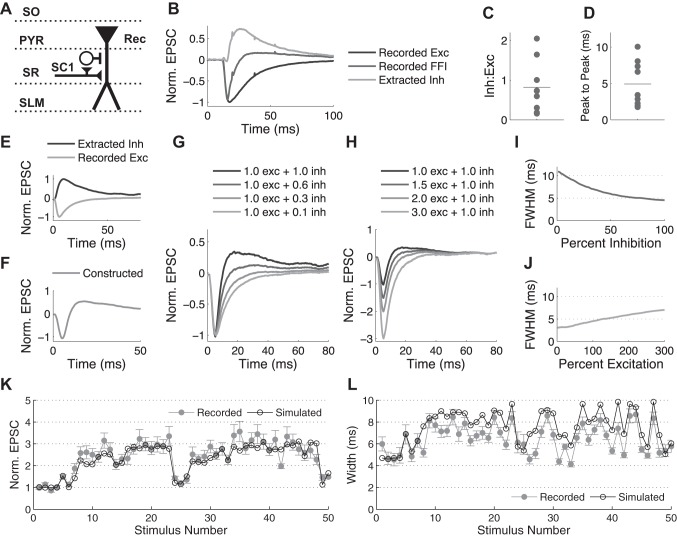
Fig. 4.
Simulations of an FFI circuit suggest the role of excitation/inhibition (E/I) balance in determining the width of EPSCs. A: schematic of stimulation protocol. Abbreviations denote hippocampal layers. B: example traces (average of 3 recordings from the same cell) showing how the IPSC component of the FFI response is extracted from experimental recordings of the EPSC/IPSC trace (−55 mV) and the EPSC trace alone (−85 mV) recorded in the same cell. C and D: ratio of IPSC to EPSC peaks (Inh:Exc; C) and time between the peaks (D) as measured at −55 mV in 7 cells; lines represent the average. E and F: average traces of recorded EPSC and calculated disynaptic IPSC (E) are used to construct the total FFI trace (F). G and H: changes in the width and amplitude of EPSC when the relative contribution of inhibition (G) or excitation (H) is varied. I and J: quantification of data in G and H, respectively, demonstrating influence of the relative contribution of inhibition (I) or excitation (J) on the width of the EPSC, measured as FWHM. K and L: close agreement between recorded and simulated FFI circuit responses during a naturalistic stimulus train. Normalized peak (K) and FWHM (L) of EPSC are plotted during naturalistic stimulus train.

