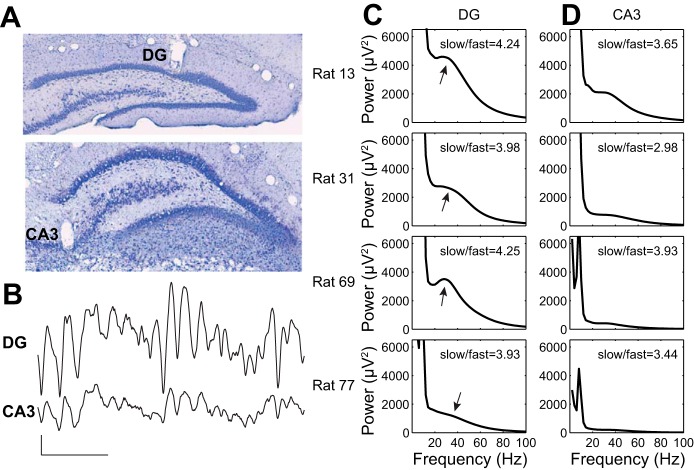
Fig. 1.
Paired recordings from DG and CA3 in freely behaving rats. A: example histological sections showing recording sites in DG and CA3. B: example pair of recordings from DG and CA3. Scale bars: 100 ms, 0.4 mV. C: DG power spectra from the 4 rats in the study. For each, the ratio of slow gamma power to fast gamma power is indicated. Arrows indicate slow gamma peaks or shoulders in the spectra. D: power spectra from simultaneous recordings from CA3 in the 4 rats. Again, the ratio of slow gamma power to fast gamma power is indicated for each recording.

