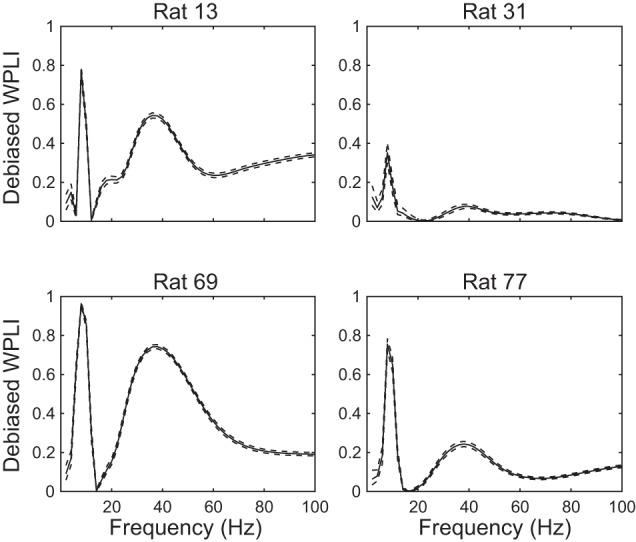
Fig. 7.

Phase synchronization across paired DG-CA3 recordings from the 4 rats in this study. Debiased WPLI measures show that theta and slow gamma phases are consistently correlated across DG and CA3 for all 4 rats. Note that slow gamma phase synchronization was greater than fast gamma phase synchronization for all 4 rats. Solid lines indicate mean WPLI, and dashed lines indicate 95% confidence intervals.
