Fig. 2.
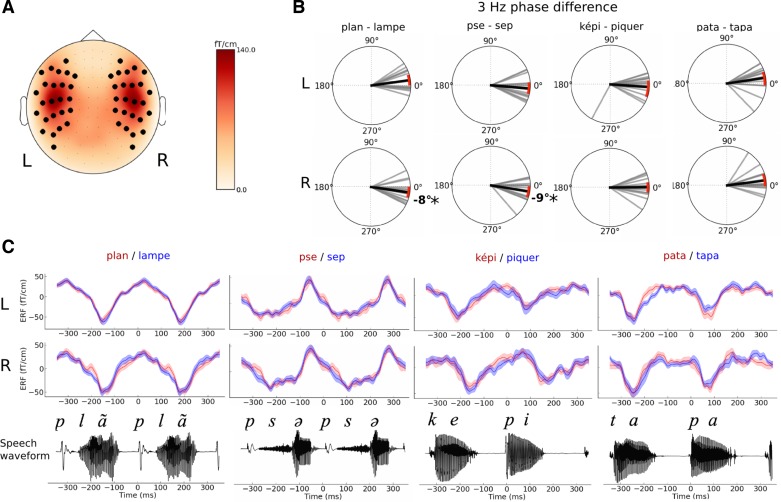
Characteristics of the 3-Hz neural response to speech. A: scalp topography of the 3-Hz auditory evoked response. Black dots illustrate the position of the selected gradiometers over the left (L) and right (R) hemispheres. B: phase differences of the 3-Hz response contrasting perceived speech utterances. Polar plots report the 3-Hz phase difference between the 2 perceptual outcomes (top, left hemispheric sensors; bottom, right hemispheric sensors). Each gray bar is an individual's phase difference between the 2 perceptual outcomes in a given condition. The black bar corresponds to the mean average phase difference across all participants. Red arcs are 95% confidence intervals (CI). C: grand average auditory evoked response fields (ERFs) that correspond to left sensors (top) or right sensors (middle). Speech waveforms are shown for each sequence (bottom). No significant changes in the ERF were observed between percepts. Shaded areas denote SE.

