Fig. 3.
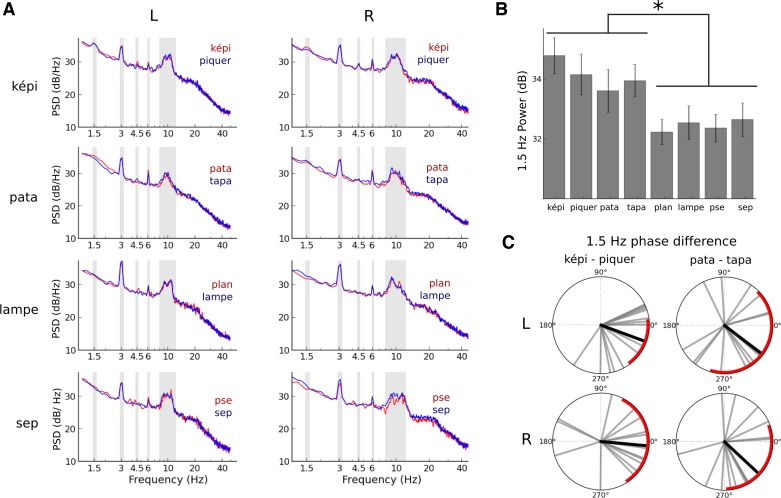
Modulations of low-frequency neural entrainment and characteristics of (sub)harmonic peak responses. A: power spectral density (PSD). The red and blue traces correspond to the PSD of brain activity in response to the presentation of the speech sequences ”képi,“ ”pata,“ ”lampe,“ and ”sep.“ Color codes for the percept that was maintained. Gray areas highlight the frequencies of interest in the spectra, e.g., 1.5, 3, 4.5, and 6 Hz and alpha band (8–12 Hz). B: increased 1.5-Hz power for bisyllabic speech sequences. 1.5 Hz power was significantly higher when participants listened to bisyllabic sequences compared with monosyllabic sequences. The power did not significantly vary between the 2 bisyllabic sequences or between the 2 monosyllabic sequences. Errors bars denote SE. C: no significant 1.5-Hz phase differences of the LFO are observed when contrasting perceived speech utterances. Each gray bar is an individual's 1.5-Hz phase difference observed when contrasting the 2 alternative percepts of a sequence. The black bar corresponds to the average phase shift across all participants. Red arcs correspond to 95% CI.

