Fig. 6.
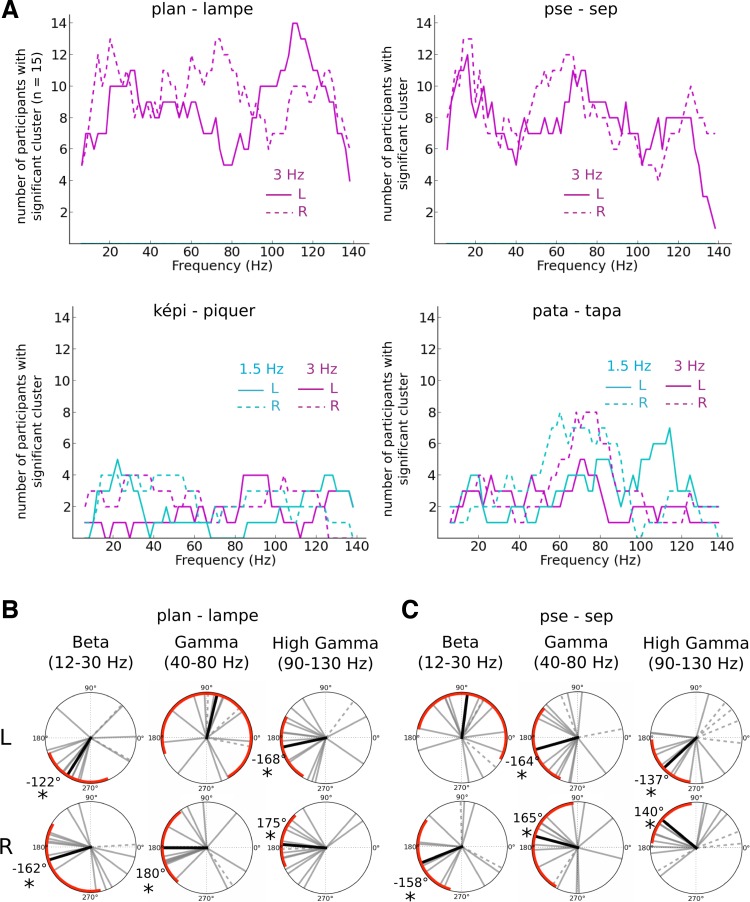
HFA latency patterns during monosyllabic word sequences. A: number of participants with significant changes between percepts in 3-Hz speech component-neural response cross-correlation (magenta lines) and 1.5-Hz speech component-neural response cross-correlation (cyan lines) for each frequency band. Data are reported in both left (solid line) and right (dashed line) temporal sensors for each sequence. We observed significant changes in the cross-correlograms for a majority of participants in the monosyllabic word sequences for frequency bands in the beta (12–30 Hz), gamma (40–80 Hz), and high-gamma (90–130 Hz) ranges. B and C: phase shifts in speech envelope tracking between each percept condition in the beta (12–30 Hz), gamma (40–80 Hz), and high-gamma (90–130 Hz) range for ”lampe“ sequences (B) and ”sep“ sequences (C). Each gray line corresponds to the phase difference between one perceptual outcome and the other for one subject. The dashed lines refer to participants for whom significant clusters were not found within the target frequency range. The black line corresponds to the average phase across subjects who showed significant difference between the percept conditions; red arcs correspond to 95% CI. We show here that the reported differences in cross-correlation were related to strong shifts in the phase of neural-speech tracking.

