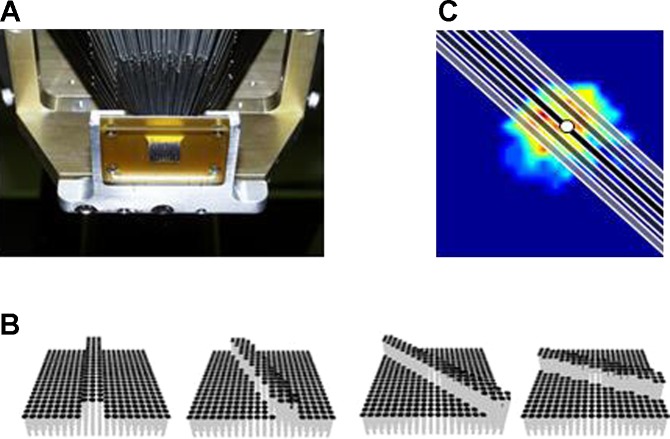
Fig. 1.
Experimental set up. A: bottom view of the 400-probe stimulator (Killebrew et al. 2007). Individual pins converge onto a 1 cm2 area over the skin. B: dequence of snapshots depicting an edge at different edge orientations. Note that pins are close enough together that the pixilation of the array is not felt. C: location of indented edges with respect to the receptive field (RF). The heat map shows the RF topography overlaid with edges at orientation 130°. The black edge is centered on the hotspot, the dark and light gray edges are displaced by ±1 and ±2 mm, respectively. The hotspot is indicated by the white circle.

