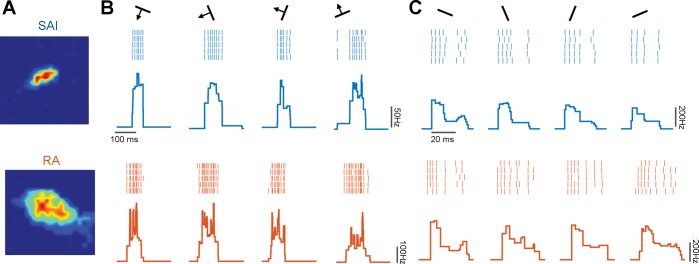
Fig. 2.
Responses to oriented edges. A: RF map for a typical slowly adapting type 1 (SA1; top) and rapidly adapting (RA; bottom) afferent. B: rasters of the response evoked in the two afferents shown in A by 5 repeated presentations of each of a subset of scanned edges and the corresponding peristimulus time histograms (SA1 in blue, RA in orange). C: responses evoked by a subset of indented edges in the same 2 afferents. Firing rate profiles are consistent within but vary across orientations for both scanned and indented edges.

