Fig. 3.
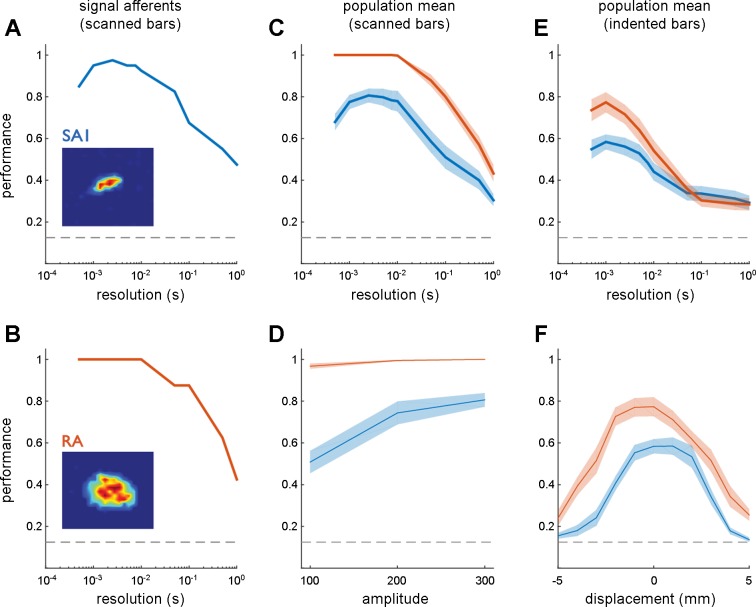
Afferent orientation signals for scanned and indented edges. A; classification performance based on the responses of an SA1 afferent to 300-μm scanned edges at 8 orientations as a function of the temporal resolution of the classifier (1/q). The leftmost extreme of the curve shows classification performance when submillisecond differences in spike timing are taken into consideration, the rightmost extreme of the curve shows classification performance based solely on spike counts over the stimulus interval. B: classification performance based on the responses of an RA afferent. C: mean classification performance based on the responses of 10 SA1 (blue) and 12 RA fibers (orange) to scanned edges. D: peak classification performance at 3 amplitudes. E: mean classification performance based on the responses of 8 SA1 and 10 RA fibers to indented edges. F: peak classification performance at different locations relative to the hotspot (located at displacement = 0 mm). In this analysis, classification is performed at each location separately. As was found in humans, tactile fibers carry considerable information about edge orientation in the precise timing of their responses. Error shading denotes mean ± SE. The horizontal dashed lines denote chance performance (0.125) given the 8 possible edge orientations.

