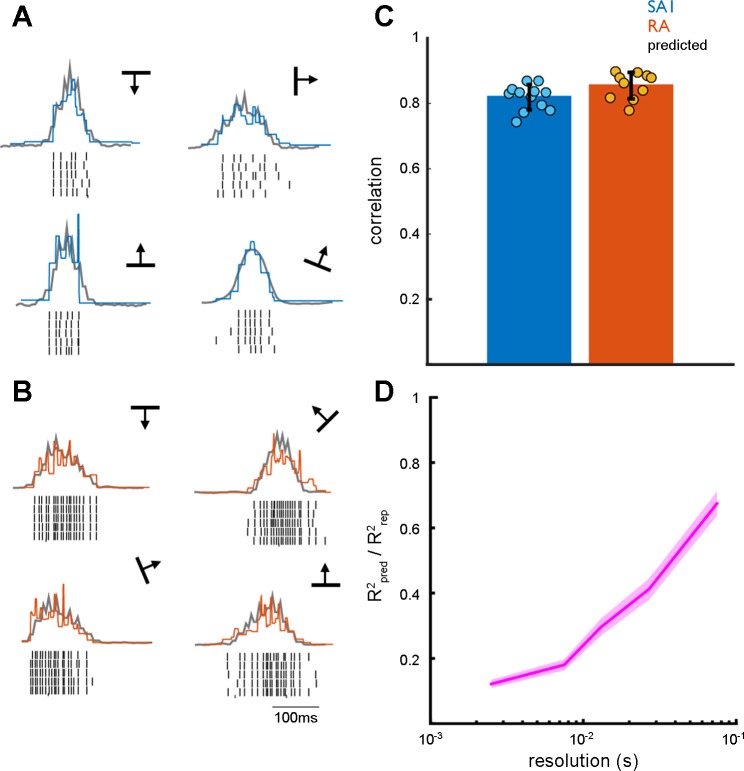
Fig. 4.
Predicting the firing rate profiles from RF topography. A: example of predicted (gray) and observed (blue) firing rate profiles for a single SA1 afferent. B: example of predicted (gray) and observed (orange) firing rate profiles for a single RA afferent. Although observed and predicted firing patterns are highly correlated, predicted firing patterns capture the coarse structure of the firing profiles, but not their fine structure. C: mean maximum cross correlation between predicted and observed firing rate profiles for SA1 and RA afferent populations. The error bar represents mean ± SE. D: ratio of R2 for predicted vs. observed (Rpred2) to the R2 for observed vs. observed (Rrep2) across multiple temporal resolutions. Error shading denotes mean ± SE. Predicted firing rate profiles closely match observed firing rate profiles at coarse but not fine temporal resolutions.

