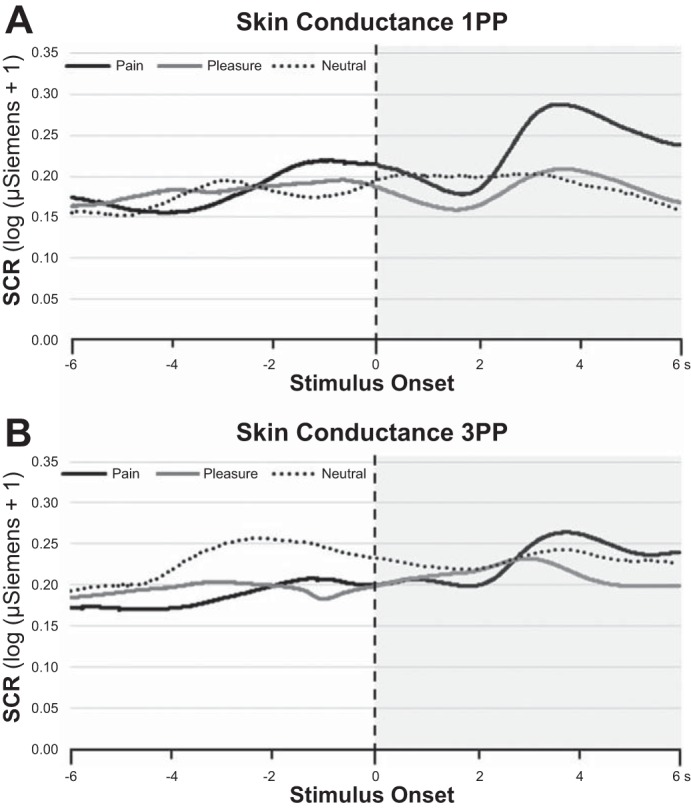
Fig. 3.

Grand average of the SC signals [data were preprocessed by separating the phasic components from tonic activity and then transformed in log(SCR + 1)] over 12 s. 1PP and 3PP conditions are represented in A and B, respectively. Zero refers to the time at which the needle (black line), caress (gray line), and ball (broken line) touched the hand of the avatar. The time window from −6 to 0 and from 0 to 6 s refers to observation of the virtual hand before the stimulus or after it impinged on the virtual hand, respectively. The gray transparent box indicates the data used for the quantitative analysis reported in Fig. 4, top.
