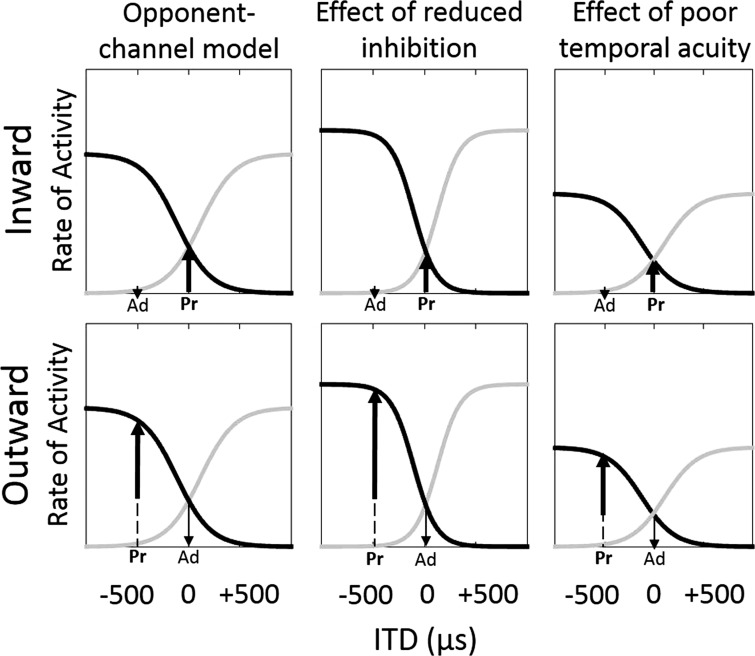
Fig. 1.
Schematic representation of the rates of neural activity in response to ITDs as modeled by a hemifield code. Black lines represent the response pattern of a neural population favoring left-leading ITDs, and gray lines represent the activity pattern for an opposing neural population that favors right-leading ITDs. In the present study, a probe (Pr) ITD immediately follows an adapter (Ad) ITD, and the relative direction of ITD shift, either inward (top row) or outward (bottom row), determines a distinct response (upward-pointing arrow). The left column presents the normally occurring output, whereas the middle column represents the hypothesized effect of reduced inhibition, and the right column represents the hypothesized effect of poor temporal acuity.

