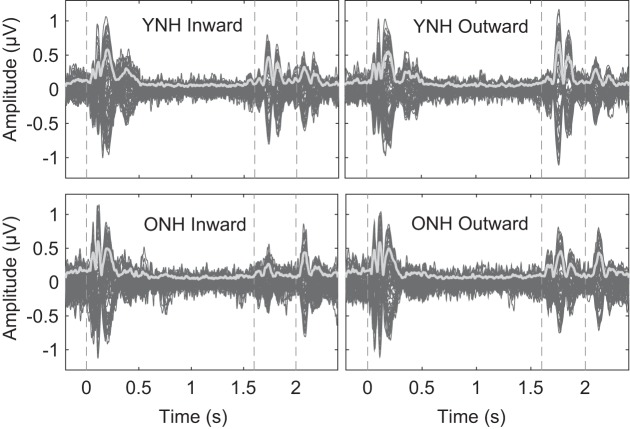
Fig. 3.
The average EEG responses to the inward (left column) and outward (right column) ITD shift conditions are displayed for the young, normal-hearing group (YNH; top row) and older, normal-hearing group (ONH; bottom row). The display consists of 64 scalp electrode recordings (dark gray lines) and the global field potential (light gray line) measured over the time window of −0.2 to 2.4 s relative to the adapter ITD onset. Vertical dotted lines indicated the onset of the adapter (t = 0 s), the transition to the probe ITD (t = 1.6 s), and the offset of the probe (t = 2 s).

