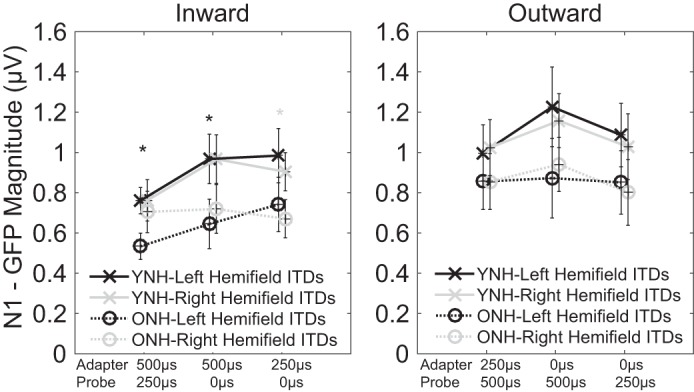
Fig. 5.

The magnitude of the GFP in the N1 component is plotted for each adapter-probe pairing. Younger, normal-hearing listeners (YNH; solid lines with × markers) generally had larger responses than older, normal-hearing listeners (ONH; dotted lines with ○ markers). Adapter-probe pairings could either be left-leading (black) or right-leading (gray). Shaded asterisks indicate significant between-group differences in the corresponding hemifield.
