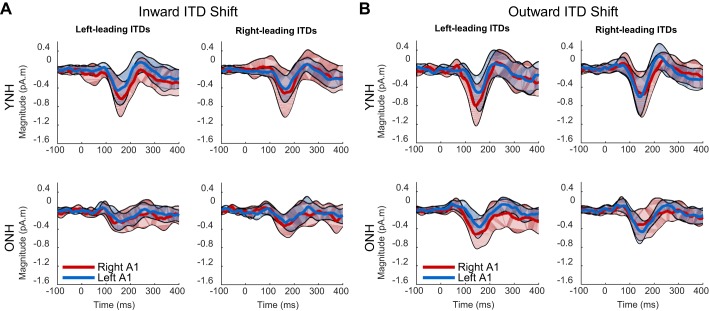
Fig. 6.
The average source-localized waveforms for left-leading and right-leading adapter-probe pairs either in the inward (A) or outward (B) direction. The YNH (top) group showed generally larger responses relative to the ONH (bottom) group. In addition, the YNH group tended to have greater responses in the right auditory cortex (right A1; red lines) relative to the left auditory cortex (left A1; blue lines). Colored shaded regions show confidence intervals (1.96 × SD) for the mean waveforms.

