
Fig. 2.
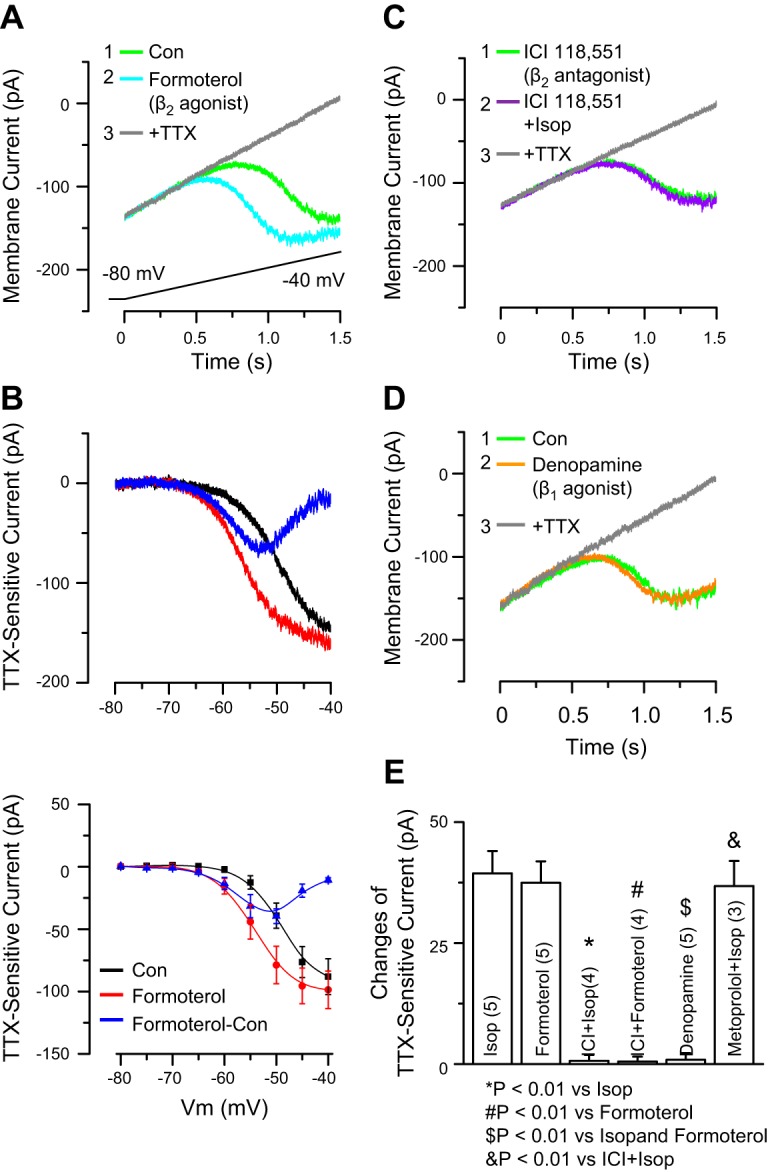
β2-, Not β1-, receptors enhance INaP. A: example ET cell recording shows that formoterol (100 nM) augments INaP elicited by a slow depolarizing voltage ramp. Inset indicates order of drug applications. B: example (top) and group data (n = 5, bottom) of subtraction I-V curves show TTX-sensitive INaP in control and formoterol (100 nM) and the net increase elicited by formoterol. Formoterol caused a leftward shift of the I-V curve with a decrease of INaP activation threshold and augmented INaP amplitude. C: example I-V curves for INaP during Isop application in the presence of the selective β2-receptor antagonist ICI 118,551 (100 nM, bath applied 5 min before Isop application). ICI 118,551 completely blocked the Isop-induced leftward shift. D: example I-V curves for INaP during bath application of the β1-receptor selective agonist denopamine (50 μM). Denopamine did not affect curves. E: group data show the net INaP amplitude change at −50 mV in the different conditions (n shown in parentheses).